Hazards: Coastal Flooding
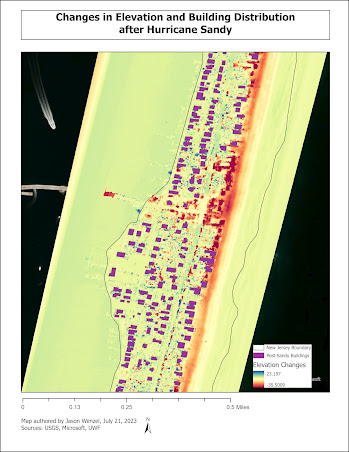
This week in GIS Applications, we examined the topic of Coastal Flooding by learning how to assess this type of hazard to communities through the delineation of coastal flood zones via various digital elevation models (DEMs). Here we used a variety of techniques and tools such as overlay analysis in vector and raster domains while examining the differences in different types such as traditional USGS DEM and LiDAR derived DEM data. For the first part, I determined the level of erosion that occurred on the New Jersey coastline, particularly in Mantoloking, as the resulting from Hurricane Sandy in 2012. Here I compared pre and post sandy LiDAR imagery of the area by creating DEMs of the area. This involved converting the .las files to TINs and using the Raster Calculator tool in order to highlight the greatest areas of erosion through a symbolized color ramp (going from red to blue). In the second part of the lab, I analyzed storm surge in Cape May County, New Jersey, by determi...