Posts

Showing posts from October, 2023

Land Use/Land Cover Classification/Ground Truthing and Accuracy Assessment

Image
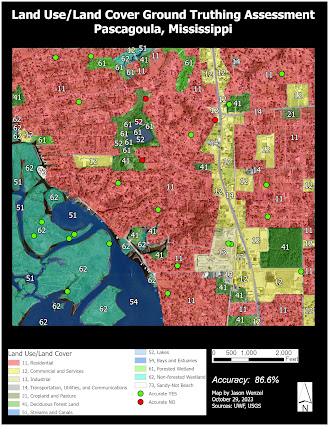
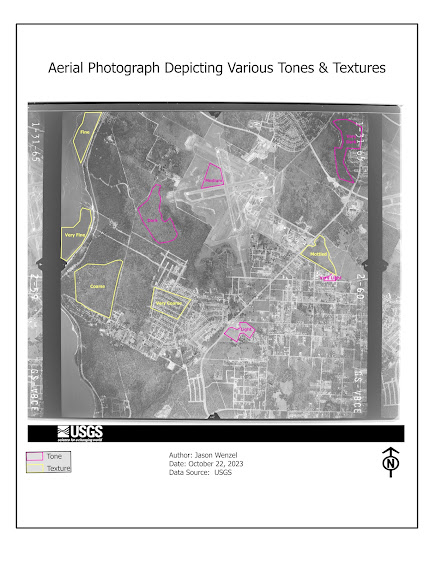
This week in GIS 5027, I learned about land use/land cover (LULC) classification, and ground truthing and accuracy assessment.  For the lab assignment, I constructed a LULC map based on an aerial photograph of the northeastern area of Pascagoula, Mississippi. Here I recognized various elements and features that facilitated the classification.  Following this, I conducted an accuracy assessment of the LULC classification by ground truthing data via Google Street View.  Below is a map that shows 30 points created via the Create Random Points tool in ArcGIS Pro.  Here I achieved 86.6% accuracy with the classification as 26 out of 30 points were verified as true: This assignment was time intensive, but helpful in enhancing my skills in aerial photograph interpretation and digitization of features.  I also found the exercise on accuracy assessment interesting as well, and I especially enjoyed the part that involved ground truthing randomly selected locations via Google Street View. I believ

Aerial Photography: Visual Interpretation

Image
This week I started GIS 5027 (Photo Interpretation and Remote Sensing) and for the first lab assignment, we covered the basics of aerial photography, specifically visual interpretation.  Here I learned how to interpret the tone and texture of aerial photographs and how to identify land features based on several visual attributes.  In addition, I learned how to compare similar land features between true color and false infrared (IR) photographs. For the first part of the assignment, I created a map that shows ten areas of interest based on either tonal or textual characteristics: After this, I created another map that shows the identification of eleven different features represented by their attribute type (association, pattern, shadow, or shape-size).  Examples of features included a cottage, a swimming pool, a segregated pavilion, and a street sign: I found this week's module topic and lab exercise helpful in enhancing my knowledge and skills in aerial photographic interpretation

Scale, Spatial Data Aggregation, Dasymetric Mapping

Image
This week I completed the final lab for GIS 5935 which focused on scale, spatial data aggregation, and dasymetric mapping. Here I learned about the effects of scale on vector data and resolution on raster data.  In addition, we covered the effect of the Modifiable Area Unit Problem (MAUP) while using regression analysis, also known as ordinary least squares (OLS) analysis.  I also learned how to identify multipart features and measure compactness. For the first part of the lab I examined the effect of scale on vector data, in this case hydrographic polyline and polygon features from Wake County, North Carolina. Understanding the meaning of scale is important in GIS, especially how this effects resolution and extent (Goodchild 2011). I found in my analysis that t he larger the scale, the increased length of polylines, perimeter lengths, area, and number of polygons. Regarding vector data, resolution can be difficult to define and if possible it is best to use raster data for this purp