Posts

Showing posts with the label GIS 5100

Least-cost Path and Corridor Analysis

Image
  For the final assignment in GIS 5100, I learned about least-cost path and corridor analysis. Least-cost path analysis determines the single best path that has the lowest cost for a given source and destination. Corridor analysis provides multiple solutions, representing a zone where the cost is close to the least-cost. The analysis I undertook involved modeling a corridor for black bear movement between two protected areas of Coronado National Forest. The factors in model development were related to the habitual preferences of black bears and included placing the corridor in an area away from roads, that are mid-elevation, and have specific types of forest and vegetation (land cover). After reclassifying values with suitability scores in three different rasters (roads buffers, elevation, and land cover), the Weighted Overlay tool was used that assigned land cover the highest weighting (60%) with elevation and distance to roads each receiving 20%. Cost surface rasters were then cr...

Suitability Analysis

Image
This week in GIS 5100, I completed the last weekly assignments for the class. The first of these focused on suitability analysis, which creates models to help analysts identify the most suitable locations based on specific criteria.  For the lab exercise, I evaluated the suitability for a development prior to its acquisition as a conservation area or site for installation of a pipeline.   By considering the type of land it occupies, its soils, slope distribution, and the proximity of streams and roads, the analysis helped inform on how much land is suitable to build on. In addition, I learned to use the Weighted Overlay tool in ArcGIS. After five different rasters were reclassified with suitability values, for the first run in the tool, all five were equally weighted (20% each).  For the second run of the tool, differential weighting was assigned: slope (40%), land cover (20%), soils (20%), distance to streams (10%), and distance to roads (10%). The map below shows the re...

Hazards: Damage Assessment

Image
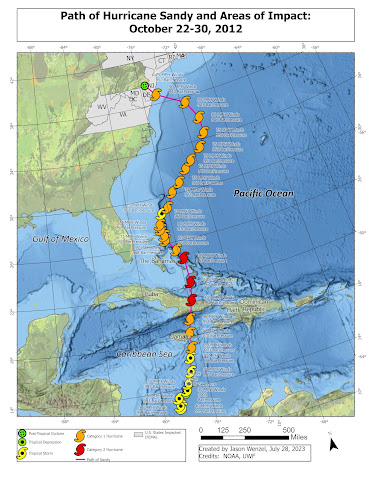
This week in GIS 5100 we continued the study of hazards with a focus on damage assessment. For the first part of the assignment, we were directed to create a map based on NOAA data of the track of Hurricane Sandy, also known as "Superstorm Sandy" showing its progression from a tropical storm in the southern Caribbean Sea on October 22, 2012 to its landfall on the northeastern coast of the United States as a Category 1 hurricane on October 29, 2012.  The path of the storm is symbolized by its type along with labels showing MPH winds and barometric pressure in specific points. The storm's maximum wind speed reached 105 MPH and the lowest barometric pressure was 940. For the next part of the assignment, I created a brief survey with ArcGIS Survey 123, which is an online platform that allows individuals to report damage and submit photographs in the field that are geocoded and can help complement remote-sensed data: Hurricane Sandy Citizen Damage Assessment* *This survey is o...

Hazards: Coastal Flooding

Image
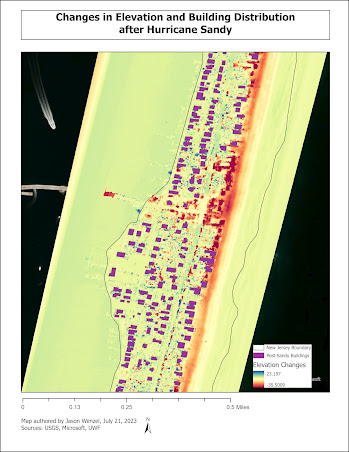
This week in GIS Applications, we examined the topic of Coastal Flooding by learning how to assess this type of hazard to communities through the delineation of coastal flood zones via various digital elevation models (DEMs).   Here we used a variety of techniques and tools such as overlay analysis in vector and raster domains while examining the differences in different types such as traditional USGS DEM and LiDAR derived DEM data. For the first part, I determined the level of erosion that occurred on the New Jersey coastline, particularly in Mantoloking, as the resulting from Hurricane Sandy in 2012. Here I compared pre and post sandy LiDAR imagery of the area by creating DEMs of the area. This involved converting the .las files to TINs and using the Raster Calculator tool in order to highlight the greatest areas of erosion through a symbolized color ramp (going from red to blue). In the second part of the lab, I analyzed storm surge in Cape May County, New Jersey, by determi...

Visibility Analysis

Image
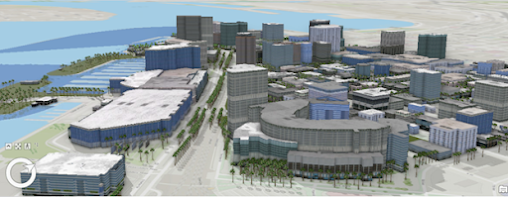
This week in GIS 5100, we learned about visibility analysis with a focus on two main types: viewshed and line of sight. As part of our assignment, we were directed to complete four different Esri courses through ArcGIS Online.  This included: Introduction to 3D Visualization, Performing Line of Sight Analysis in ArcGIS Pro, Performing Viewshed Analysis in ArcGIS Pro, and Sharing 3D Content using Scene Layer Packages. For the first course, Introduction to 3D Visualization, I learned about using local and global scenes, and their differences, cartographic offset, vertical exaggeration, extrusion and applying 3D symbology, and making visual enhancements, such as displaying shadows, adjusting altitude, and ambient occlusion.  For one of this course's activities, I used an ESRI authored global scene of Downtown San Diego, CA, by applying 3D symbology. Here I was able to work with shadows, illumination, time of day and ambient occlusion.  This was the most interesting scen...

LiDAR

Image
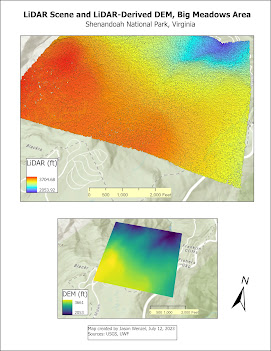
This week in GIS applications we learned about LiDAR.  LiDAR stands for "Light Detection and Ranging", and while it has been traditionally used in forestry science, as related to this week's lab topic, it is increasingly being used in archaeological research, which is my primary area of study. For this week's lab, we worked with LiDAR data from the Shenandoah National Park, Virginia, to examine tree height and tree canopy density.  To do this, LiDAR data was obtained from the USGS in the form of an .las file, and then converted to a digital elevation model (DEM). To do this, I used the LAS Dataset to Raster tool in ArcGIS. This map shows the LiDAR point cloud along with DEM produced: Next, I calculated forest height from the DEM and created a map from it along with an accompanying tree height chart: Finally, I calculated biomass density by using the following tools in order: LAS to MultiPoint, Point to Raster, Is Null, Con, Plus, and Divide: Overall, I found this wee...