Hazards: Damage Assessment
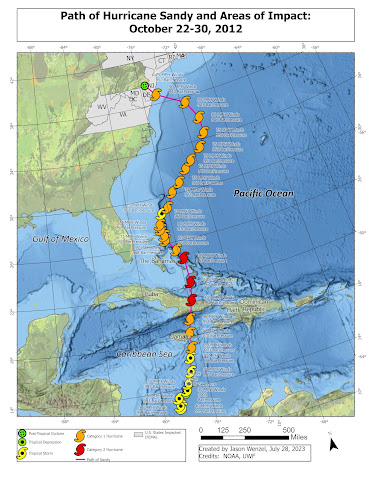
This week in GIS 5100 we continued the study of hazards with a focus on damage assessment. For the first part of the assignment, we were directed to create a map based on NOAA data of the track of Hurricane Sandy, also known as "Superstorm Sandy" showing its progression from a tropical storm in the southern Caribbean Sea on October 22, 2012 to its landfall on the northeastern coast of the United States as a Category 1 hurricane on October 29, 2012. The path of the storm is symbolized by its type along with labels showing MPH winds and barometric pressure in specific points. The storm's maximum wind speed reached 105 MPH and the lowest barometric pressure was 940.
For the next part of the assignment, I created a brief survey with ArcGIS Survey 123, which is an online platform that allows individuals to report damage and submit photographs in the field that are geocoded and can help complement remote-sensed data:
Hurricane Sandy Citizen Damage Assessment*
*This survey is only accessible with a UWF ArcGIS login.
Following this, I prepared a raster mosaic in ArcGIS where I compared aerial imagery from before and after Hurricane Sandy as way to discern changes in structures in the area of impact. The focus was on a section of Ortley Beach, a community in Toms River, New Jersey:
I created a polyline feature class (shoreline) from the pre-storm imagery and then used the Multiple Ring Buffer tool to create another feature class with three zones by their distance from the shoreline (0-100 m, 100-200 m, 200-300 m). I then used the Spatial Join tool to join these two feature classes in order to do an analysis via the Select by Attributes tool. I queried each of the four structure types (Affected, Minor Damage, Major Damage, and Destroyed) with corresponding keys (in order 1 through 4) with the AND condition run three separate times (for distances of 100, 200, and 300). I then recorded the counts in the table above. No buildings were classed as No Damage, as it was presumed all properties were somehow affected based on damage in the vicinity.
My analysis covered a total of 96 structures identified in the study area based on the pre-storm raster imagery. In terms of distance from the coastline, 9 properties (9%) are within 100 m of the shoreline, 45 (47%) are between 100 and 200 meters, and 42 (44%) are between 200 and 300 meters. In terms of the level of destruction, 47 (49%) were affected, 17 (17.7%) sustained minor damage, 18 (18.8%) sustained major damage, and 14 (14.%) were destroyed.
Over half of the houses (67%) within 100 meters of the coast were destroyed while significantly less (15%) were destroyed between 100-200 meters, and even those between 200 and 300 meters (2%). All structures within 100 meters experienced at least minor damage, while just over ¼ (29%) of structures within 100 meters and 200 meters experienced minor damage, and even less for those between 200 to 300 meters (7%).
While any structure in proximity of this ocean coastline is at risk to a variety of weather events, it is clear from this analysis that distance between shoreline and structure play a significant role in mitigating these factors, even at relatively smaller increments (100, 200, and up to 300 meters in distance). The closest structures experienced some form of damage, mostly complete destruction, while almost half of those at least 200 meters away were only affected escaping any recognizable damage based on aerial photographic inspection alone. In terms of extrapolating this, I believe this data is useful, but the study area should be expanded. Therefore it is advised that reasonable setbacks of developments from shorelines, especially in light of the eminent threats from rising seas and increased storm events, be in place to mitigate future risks at best as possible.
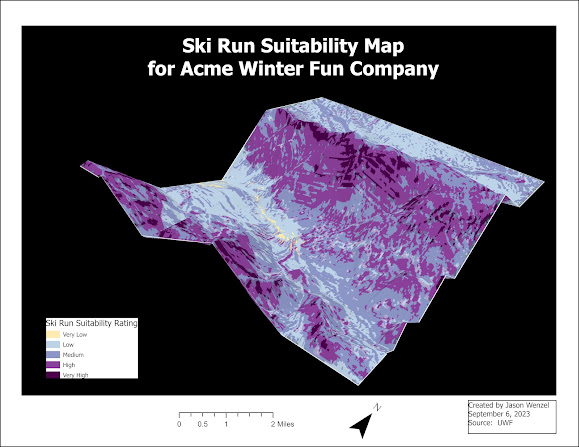
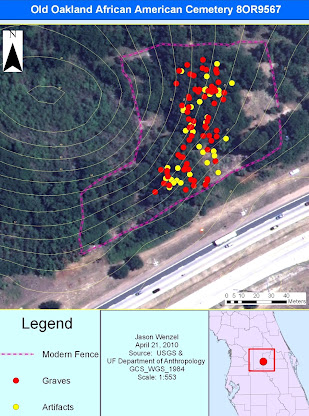
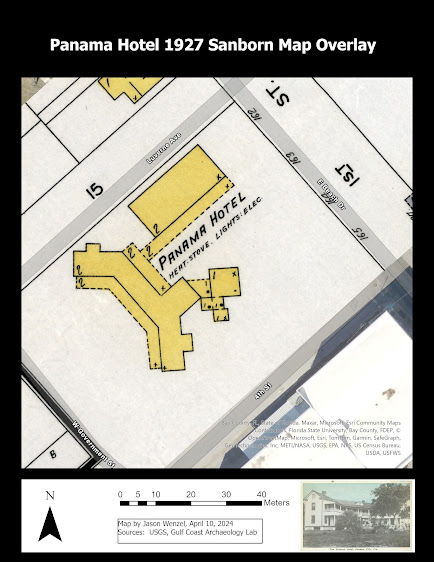
For the final task in the lab, graduate students were directed to create an ArcGIS Story Map using data and results from this week's lab as well as the previous (Hazards: Coastal Flooding):
GIS and Hazard Assessment: Four Case Studies
I enjoyed completing this week's lab and it is one my my favorite assignments I have worked on in the program so far. I was able to learn how to use GIS to assess damage from storms which is a topic I have general interest in as an anthropologist studying the impact of disasters on human societies past and present. In addition, this lab provided opportunities to refresh and improve my current skills and knowledge in using ArcGIS but also learn some new information as well. My favorite part was learning how to compare pre and post storm damage via photographic aerial images, evaluate and identify the patterns of damage, and explore other ESRI applications such as ArcGIS Survey 123.


Comments
Post a Comment