Data Classification
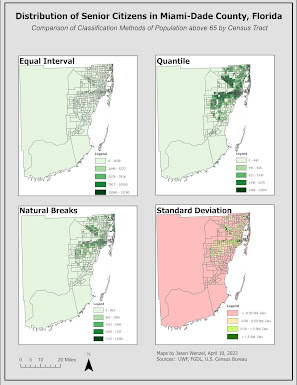
This week in Computer Cartography we covered data classification where we were directed to produce maps showing the distribution of senior citizens (individuals above the age of 65) in Miami-Dade County in tract data from the U.S. Census of 2010. For the main objective, students were tasked to use and assess four different methods of data classification in this pursuit: equal interval, quantile, natural breaks, and standard deviation. Further, we needed to use two different variables from the census data: the percentage of individuals above 65 and the number of individuals (normalized by square mile) above 65. A total of eight maps were produced with four comprising a composite related to each of the two different age variables. In addition, I selected one of the eight that I felt best conveys the distribution of seniors in Miami-Dade County.I used a green continuous choropleth scheme for all of the maps except for the ones classed on standard d...