Posts

Showing posts with the label GIS 5027

Remote Sensing Final Project

Image
I finished GIS 5027 with a final project that examined land use land cover (LULC) changes in South Lake Tahoe, California. I investigated changes in the distribution of impervious surface areas to assess the extent of urbanization by comparing European Space Agency (ESA) Sentinel-2 mission satellite data from 2016 and 2023. By using ERDAS Imagine and ArcGIS software, I created two final maps reflecting the work completed on my project.  The first map shows LULC derived from supervised image classification of the 2023 image of five distinct classes of landcover (Buildings, Forest, Lakes, Roads, and Wetlands).   It is estimated from this subset image that impervious surface comprises 42.4%, excluding the areas identified as “Lakes”:   The second map includes a false color urban RGB composite of the same 2023 subset image. This uses a combination of Bands 12, 11, and 4 displayed as R-G-B respectively. It clearly makes the vegetation (pervious surface) stand out in green from...
Unsupervised and Supervised Image Classification

Image
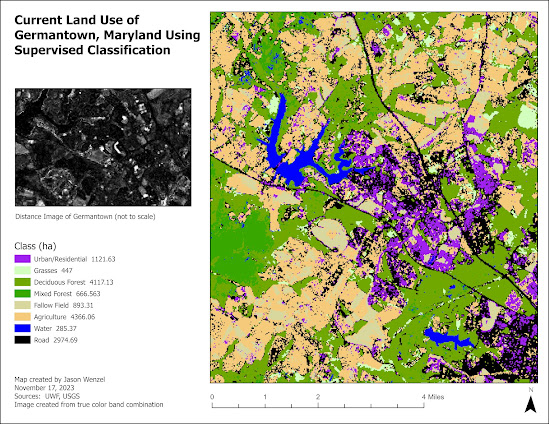
This week in GIS we covered unsupervised and supervised image classification where we conducted digital image processing in ERDAS Imagine software to collect and evaluate spectral signatures from satellite imagery. For the first part of the assignment, I conducted an unsupervised classification of surface types from a high resolution aerial photograph of the UWF campus in order to determine the amount of coverage of permeable vs. nonpermeable areas. For the the second part of the assignment, I conducted a supervised classification of land use of Germantown, Maryland based on a true color satellite image: Overall, I enjoyed completing this week's assignments and found the skills and techniques I learned helpful in expanding my proficiency in GIS.

Image Preprocessing: Spatial and Spectral Enhancements and Band Indices

Image
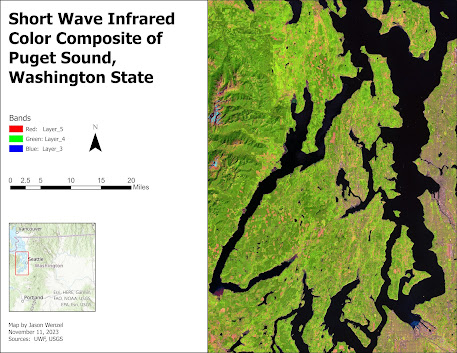
This week in GIS 5027, we learned about image preprocessing, specifically how to apply spatial enhancements for imagery use, and how to view the properties of multispectral imagery and create band indices. For the main part of the assignment I prepared maps of three different features in the vicinity west of the greater Seattle, Washington area, each using a different band combination. Working with the ERDAS Imagine software, and following the lab instructions, I identified these features from a LANDSAT Thematic Mapper derived image by following four steps:     1. Examined the histogram for shapes and patterns in the data.     2. Visually examined the image as grayscale for light or dark shapes and patterns.     3. Visually examined the image as multispectral, changing the band combinations to make certain         features stand out.      4.  Used the Inquire Cursor to find the exact...

Electromagnetic Radiation (EMR), Satellite Sensors, and Digital Image Processing

Image
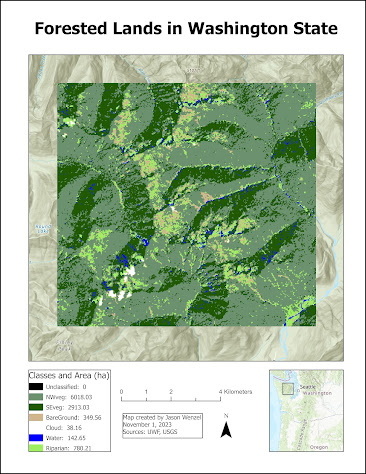
This week in GIS 5027, we covered electromagnetic radiation (EMR), Satellite Sensors, and Digital Image Processing. For the first part of the lab, I learned how to calculate wavelength, frequency and energy of EMR and use basic tools in ERDAS Imagine.   I created this map from a classified image of forested lands in Washington State.  By using the Inquire tool in ERDAS Imagine, I selected a subset from this and then calculated the size of each class (in hectares) via the creation of a new attribute column. After saving the subset as an output file, I imported it into ArcGIS, where I adjusted the layer's symbology with seven different classes, each showing its total area in the subset in hectares in the map's legend: For the second part of the lab, I learned about four different types of resolutions (spatial, radiometric, spectral, and temporal), their relationships with pixel and/or image size, and how to identify each in ERDAS Imagine.  For the exercise,  I exp...

Land Use/Land Cover Classification/Ground Truthing and Accuracy Assessment

Image
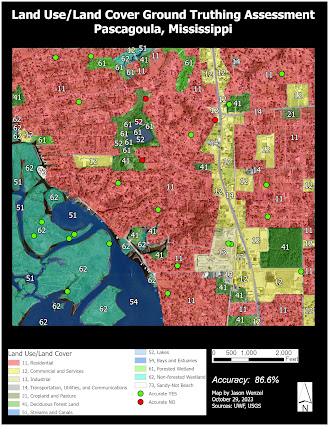
This week in GIS 5027, I learned about land use/land cover (LULC) classification, and ground truthing and accuracy assessment.  For the lab assignment, I constructed a LULC map based on an aerial photograph of the northeastern area of Pascagoula, Mississippi. Here I recognized various elements and features that facilitated the classification.  Following this, I conducted an accuracy assessment of the LULC classification by ground truthing data via Google Street View.  Below is a map that shows 30 points created via the Create Random Points tool in ArcGIS Pro.  Here I achieved 86.6% accuracy with the classification as 26 out of 30 points were verified as true: This assignment was time intensive, but helpful in enhancing my skills in aerial photograph interpretation and digitization of features.  I also found the exercise on accuracy assessment interesting as well, and I especially enjoyed the part that involved ground truthing randomly selected locations via Goog...

Aerial Photography: Visual Interpretation

Image
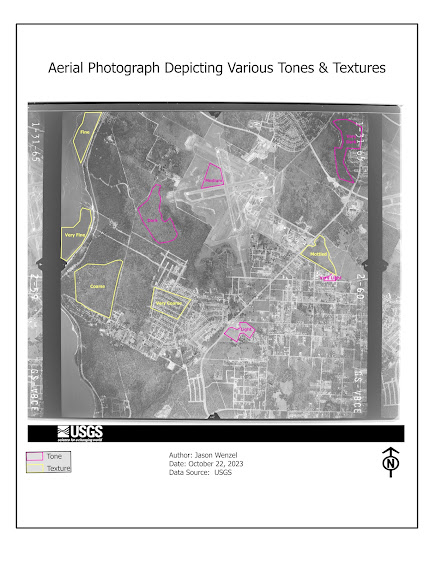
This week I started GIS 5027 (Photo Interpretation and Remote Sensing) and for the first lab assignment, we covered the basics of aerial photography, specifically visual interpretation.  Here I learned how to interpret the tone and texture of aerial photographs and how to identify land features based on several visual attributes.  In addition, I learned how to compare similar land features between true color and false infrared (IR) photographs. For the first part of the assignment, I created a map that shows ten areas of interest based on either tonal or textual characteristics: After this, I created another map that shows the identification of eleven different features represented by their attribute type (association, pattern, shadow, or shape-size).  Examples of features included a cottage, a swimming pool, a segregated pavilion, and a street sign: I found this week's module topic and lab exercise helpful in enhancing my knowledge and skills in aerial photographic inte...