Image Preprocessing: Spatial and Spectral Enhancements and Band Indices
This week in GIS 5027, we learned about image preprocessing, specifically how to apply spatial enhancements for imagery use, and how to view the properties of multispectral imagery and create band indices.
For the main part of the assignment I prepared maps of three different features in the vicinity west of the greater Seattle, Washington area, each using a different band combination. Working with the ERDAS Imagine software, and following the lab instructions, I identified these features from a LANDSAT Thematic Mapper derived image by following four steps:
1. Examined the histogram for shapes and patterns in the data.
2. Visually examined the image as grayscale for light or dark shapes and patterns.
3. Visually examined the image as multispectral, changing the band combinations to make certain
features stand out.
4. Used the Inquire Cursor to find the exact brightness value of a particular area.
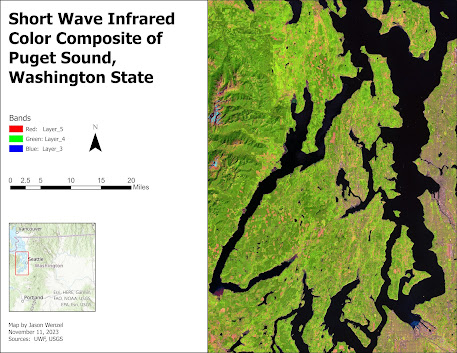
The first map shows a short wave infrared color composite of Puget Sound. This band nicely delineates the water feature (as dark blue to black) from land shown in shades of green (crops, vegetation, wetlands), bare soils (magenta or pink), and urban areas (violet):
The second map shows a true color composite of Mount Olympus. The band essentially shows what the "naked eye" of most humans would see. This band does an adequate job in contrasting the bright white, snow-covered peak with the darker forested areas underneath:
The third map shows a near infrared color composite of North Bay. This band worked better than the true color and short wave infrared in showing the difference in depths in the water body as shades of blue and black in contrast to the land areas that show a heavy amount of red tones (crops, vegetation, wetland), as well as some cyan to light green tones (urban areas and bare soils):
I enjoyed completing this week's assignment and found it very helpful in expanding my knowledge and skills in remote sensing work. At first, I was mildly intimated with all the information I encountered such as the various land mapping sensors, systems, software, bands, layers, etc. By the end of the lab assignment, however, some of this started to make more sense to me. I especially enjoyed applying the different types of band by working with the individual colors and layers.


Comments
Post a Comment