Surfaces: TINs and DEMs
In this week’s
lab, we learned about the use of surfaces in GIS, specifically creating,
editing, and analyzing TINs and DEMs. Through the assignment, I was able to
create 3D visualizations of elevation models, use various input data sets to
create and modify TINs, and compare the properties and derivatives of TIN and DEM elevation models. TIN is abbreviated for triangulated irregular network; it is one model that is used to represent surfaces including elevations, through a combination of point, line, and area features (Boldstad and Manson 2022:40). DEM refers to digital elevation model or digital terrain model (DTM) and it is commonly used for terrain analysis (2022:66). TINs are essentially a DEM but in the form of vector-based data whereas other DEMs can be derived through a raster grid. One of the drawbacks of TINs, however, is that they are
less widely available than raster surface models, and tend to be
more expensive to build and process because of the complex data
structure. (ESRI 2023).
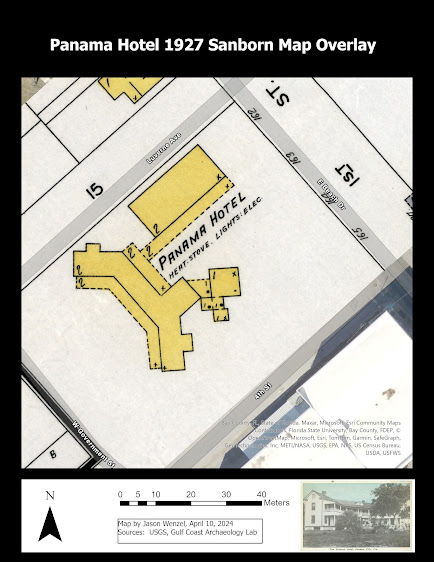
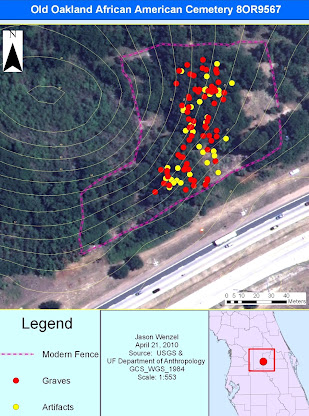
The lab assignment consisted of four parts where for the first, I draped an image over a terrain surface by using the TIN as a "blanket" for the elevation source. I also learned how to exaggerate the visual appearance of the terrain. For the second part, I used a DEM to develop a ski run suitability map. This was my favorite of the four and below is a screen shot of my ski run suitability map layout for the hypothetical "Acme Winter Fun Company." To create this map, I started with a local scene in ArcGIS Pro, then added a provided elevation DEM to be converted to a TIN. After making some adjustments, such as increasing the exaggeration, I used the Reclassify tool on the elevation DEM and created a slope raster from this that was then reclassified to values provided in the instructions. Next, I created an aspect raster in degrees from the DEM, reclassified it, and combined all three rasters. I then reclassified the combined raster and then used the Weighted Overlay tool in order to produce suitability ratings on a scale of 1 to 5 (5 being the very best, or "Very High").

The other two parts of the lab involved exploring the symbology of TINs, and how to modify them. I also learned about creating and analyzing TINs by comparing differences in contour lines from the TIN from those from raster data produced via the Spline tool.
Overall I found this module and lab very interesting and helpful. I had previously worked with some of these types of tools and completed similar tasks across a variety of assignments in other GIS courses. However, I found it beneficial to be able to focus more intensely on the methods as the main part of the assignment, and better understand the potential for the application.
2022 Boldstad, Paul and Steven Manson
GIS Fundamentals: A First Text on Geographic Information Systems, 7th edition. Minnesota: Eider
Press.
2013 Wasklewicz, T., Reavis, K., Staley, D.M., Oguchi, T.
Digital terrain
modeling. In: Shroder, J. (Editor in Chief), Bishop, M.P. (Ed.), Treatise on
Geomorphology. Academic Press, San Diego, CA, vol. 3, Remote Sensing and
GIScience in
Geomorphology, pp. 130–161.
Comments
Post a Comment