Suitability Analysis
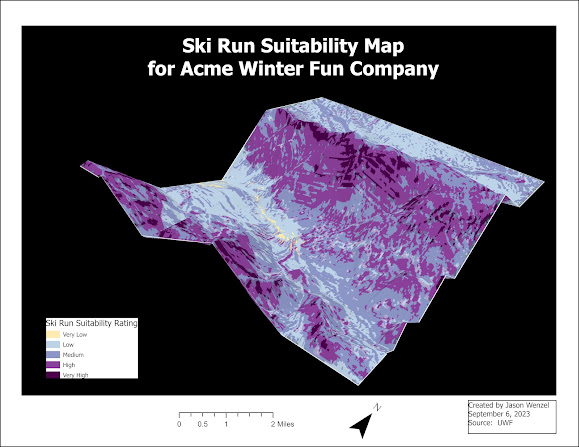
This week in GIS 5100, I completed the last weekly assignments for the class. The first of these focused on suitability analysis, which creates models to help analysts identify the most suitable locations based on specific criteria. For the lab exercise, I evaluated the suitability for a development prior to its acquisition as a conservation area or site for installation of a pipeline. By considering the type of land it occupies, its soils, slope distribution, and the proximity of streams and roads, the analysis helped inform on how much land is suitable to build on.
In addition, I learned to use the Weighted Overlay tool in ArcGIS. After five different rasters were reclassified with suitability values, for the first run in the tool, all five were equally weighted (20% each). For the second run of the tool, differential weighting was assigned: slope (40%), land cover (20%), soils (20%), distance to streams (10%), and distance to roads (10%). The map below shows the results of the analysis with the image on the left featuring equal values (20% for each category) and the one on the right showing alternative weights.

Comments
Post a Comment