Choropleth Mapping
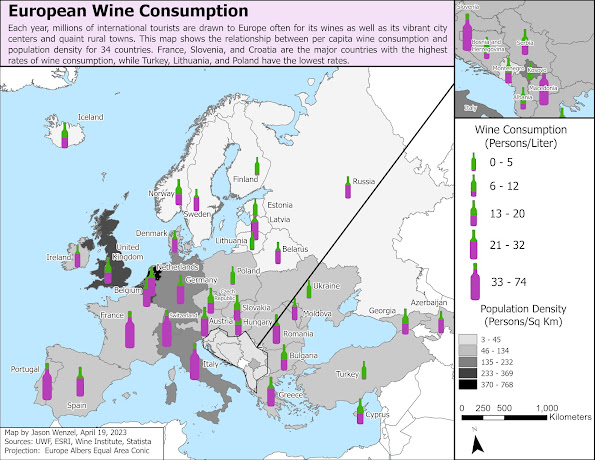
For this week’s module in Computer Cartography, I created a map that displays the rate of wine consumption in relation population density for 34 European countries. For the primary map, I used custom graduated symbols by creating a five-tier wine bottle marker scheme, to show different levels of wine consumption per capita for each country (litter/person). I did this by downloading a creative commons/free .jpg of a wine bottle, editing it to show a green base (for the bottle/container) and then creating five different versions with purple fill to show different levels of consumption (the most filled with purple, the highest level). I then converted these to individual .svg files to import into ArcGIS. Further, I did use some proportional scaling to size each one different (the larger the bottle, the higher the wine consumption) to better convey the variation along with the level of purple fill.
To show
population density of the associated European countries, I used a light gray
continuous scheme Considering the figure-ground relationship and visual
hierarchy, I believe this lighter base/countries bring the wine bottles into
relief, while showing the name/labels of each country. Further, I believe these colors blend well
with the blue base, indicating bodies of water. Also formatted the title and narrative bar background in a light purple, as I believe it works well with the other colors and compliments the theme of wine-like color tones.
To help the viewer discern the individual name labels for each country, I used the halo effect to bring them into better relief. I created an annotation feature class to move some of the country’s labels around. I finished with adding the rest of the essential map elements including the legend, scale, north arrow, and author/source/projection/date information.
Overall, I found this lab to be helpful in strengthening my cartographic design skills, while learning to use some new techniques (editing and converting graphics to .svg files). From a geographical/culture perspective, I found the topic interesting as well, given my research interests in tourism and alcohol consumption.


Comments
Post a Comment