Google Earth
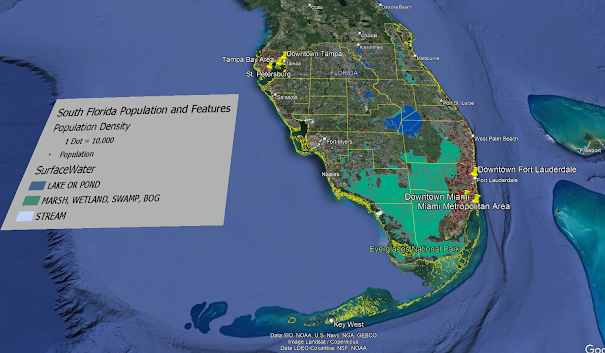
This week in Computer Cartography, I completed the last course module which involved the creation of a Google Earth map showing the locations of 23 south Florida counties, their population densities, and surrounding water features. To do this, I converted dot density and surface water layers in ArcGIS to KML (KMZ files) then imported into Google Earth. Previously, I adjusted the symbology for three distinct water features in the surface water layer to correspond to the provided legend. After the KMZ files were opened in Google Earth, I added the legend, and then adjusted the borders for the 23 counties in yellow.
I ended with preparing a recorded tour with narration showing the locations of six areas: the Miami metropolitan area, Downtown Miami, Downtown Fort Lauderdale, the Tampa Bay area, St. Petersburg, and Downtown Tampa. To do this, I created place marks for each of these areas, then used the Record a Tour feature. In my tour, I gave general reference to significant environmental, civic, historical, and archaeological aspects of each area. I mentioned some noteworthy archaeological sites and projects I had some prior familiarity with. At the end, I saved the tour as a KMZ file to share.
Overall, I enjoyed completing this module and found it useful for some of the projects I hope to develop in the future. I envision using Google Earth maps and tours to share information about some of the archaeological and historic sites I have completed research on. I believe that this platform provides a great way to make my work accessible and engaging to the public. I am also interested in using it for assignments given out in my own classes.
Below is a screen shot of my map:


Comments
Post a Comment