Isarithmic Mapping
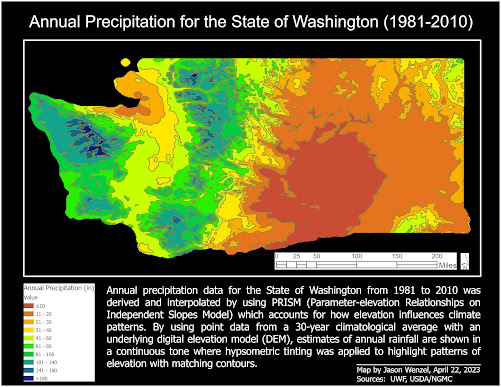
This week in Computer Cartography we learned about isarithmic mapping. For our lab activity, our primary task was to create a map illustrating annual precipitation data for the State of Washington from 1981 to 2010 that was derived and interpolated by using PRISM (Parameter-elevation Relationships on Independent Slopes Model) which accounts for how elevation influences climate patterns, as in this case precipitation. By using point data from a 30-year climatological average with an underlying digital elevation model (DEM), estimates of precipitation are shown in a continuous tone where hypsometric tinting was applied to highlight patterns of elevation with matching contours.
I appreciate the opportunity that this week's module has provided to me in learning about this type of mapping. I could envision application of isarithmic maps in some of my own research, such as in conveying deeper historical data on climate or illuminating the dynamics of other variables such as human travel-time distances for various epochs.


Comments
Post a Comment