Posts

Map Elements and Typography
Image
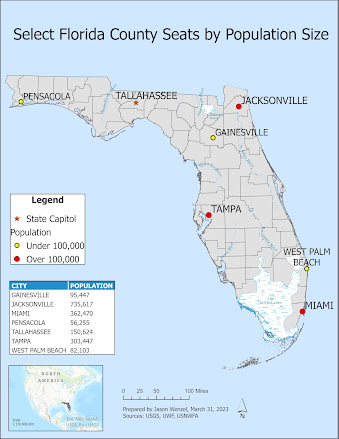
This week in Computer Cartography (GIS 5007), I completed Module 2 which covered map elements and typography.  This module was helpful in reinforcing and sharpening some of the existing knowledge learned and skills developed in Introduction to GIS, in addition to learning a few new things, such as the importance of placement, color, size, symbolization, and much more for various icons, labels, and other features used in map layouts.   For the module, I prepared a map of Florida that shows the locations of six different Florida county seats by population size. I incorporated t hree customizations to this map include delineating select county seats by population (larger red circles for cities over 100,000 and smaller yellow circles for cities under 100,000), inserting a data table listing the numeric population values, and using swamp/water default for the swamps’ symbology. Overall, I am pleased with the map produced, and I felt that this week's activities provided a need...
Map Evaluation

Image
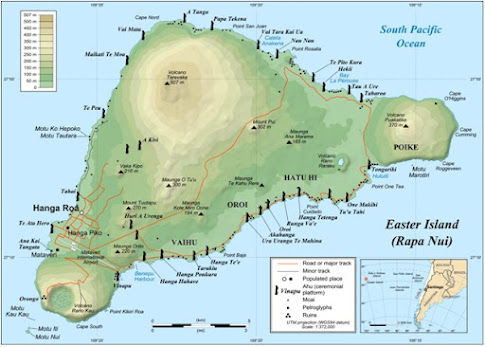
This week in Computer Cartography I completed the first lab which involved the evaluation of two different maps (one well-designed map and one poorly-designed map) that we were able to select from several provided in our lab materials. The maps were evaluated using a map evaluation template provided to the class.  In addition, I evaluated the well-designed map with three of the six commandments of map design based on the 20 "Tufteisms" from statistician Edward Tufte's The Visual Display of Quantiative Information .  I end with making three main recommendations to improve the poorly-designed map. For the well-designed map, I selected an example of a map of Rapa Nui (Easter Island) because I am interested in developing something similar for my own projects:   a topographic reference map that shows archaeological sites and features in relation to elevation, major roads, cities, and the coastline. Based on Commandment 1 (Map Substantial Information), I believe this map show...

Computer Cartography!

Image
This week I started Computer Cartography (GIS 5007), which is my second course in the graduate certificate in GIS at UWF. I hope to enhance the knowledge I learned in the previous class, Introduction to GIS (GIS 5050), while expanding my knowledge and skill base in GIS and in cartographic design principles. Recently I resumed archaeological fieldwork with my Gulf Coast State College students at an important historic/archaeological site in Panama City.  We are currently exploring sites associated with the "lost" town of St. Andrews (1827-1863). For more information on the project, please check out My Story Map . Below is a cut and zoom of the 1855 U.S. Coastal Survey Map of St. Andrews City.  I hope to eventually work with this map/image formally in GIS, including overlaying it with modern aerial photographs and topographic maps, georefencing archaeological field data to it, and incorporating all the proper map elements in the final layout.

Final Project!

Image
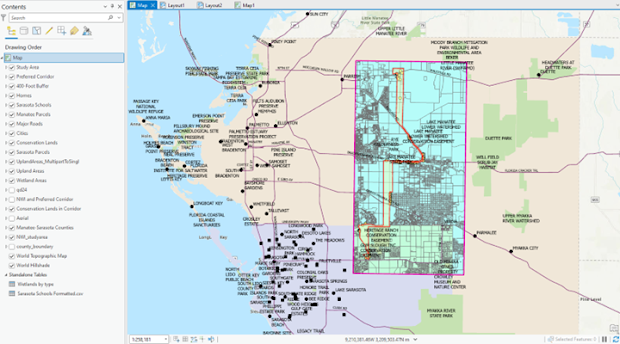
Today I finished my Final Project for GIS 5050.  Overall, I felt like I did satisfactory project, but unfortunately, I did not finish the fourth, or final objective, which was to estimate the engineering costs of the line through a digitization and computational process. Overall though, I found the project helpful in reinforcing the skills and knowledge I learned in this course, though I encountered a few difficult moments.  This included problems geocoding the Sarasota County Schools list table but this was because I incorrectly used the 2022, instead of 2020 Census edges file.  I wish I had more time to work on the project by finishing the final objective, but I must move on to prepare for the next course in the GIS graduate certificate program. Here is a screenshot of all the layers for my final project over the basemap.  Of course it is messy, so I will follow with an example of two of the analytical maps I created.   This map, for Objective #1, shows the en...

Georeferencing Lab

Image
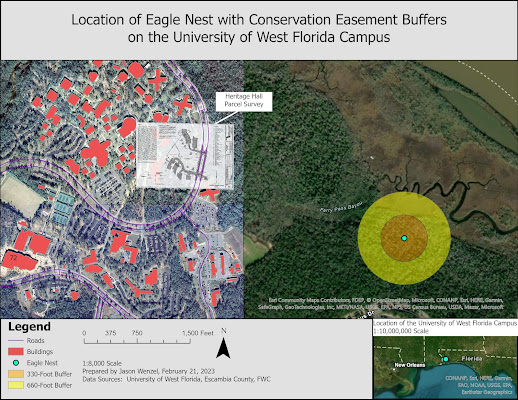
Today I completed my last weekly lab for GIS 5050 where I learned about georeferencing, editing, and creating 3D models.  This was probably the most time intensive lab of the six though I did not necessarily find it that difficult in terms of getting stuck on a specific task.  The lab just took a while to complete.  For the first exercise, I created a map that shows the University of West Florida campus in relation to an eagle nest immediately to the east in a forested area.  For this task, I created a multi-ring buffer with color-coded 330 and 660 foot conservation easement buffers.  In addition, I digitized two campus features from the raster:  Building 72 and Campus Lane.  I also georeferenced the survey plat for Heritage Hall by using control points, monitoring RMS values, and doing a polynomial transformation. For the second task, I used some of the same elements and tasks from the previous one but created a 3D model of the UWF campus. I converted...

Spatial Analysis Lab

Image
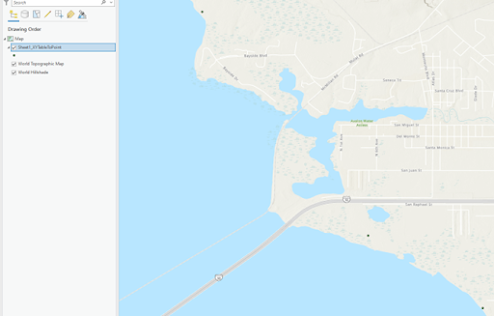
This week in GIS 5050 I completed a spatial analysis lab that involved two main tasks:  adding XY data and geocoding.  For the first part, I learned how to use an Excel spreadsheet to add XY values (latitude and longitude), and specifically how to convert DMS values (degrees, minutes, seconds) into decimal degrees.  Below is the deliverable for the lab that is a screen capture from the map frame that shows the locations of three eagles nests in western Santa Rosa County near the shore of Escambia Bay.  For the second half of the lab, I learned how to geocode addresses by copying data from an internet page, copying into, and then modifying in Excel, and then importing into ArcGIS.  For this example, I geocoded the location of schools in Manatee County, Florida.  I also learned how to geocode unmatched addresses by doing my own sleuthing (i.e. Google and map searches).  The map shows the location of 82 schools (point file) including one university and co...

Vector Analysis Lab

Image
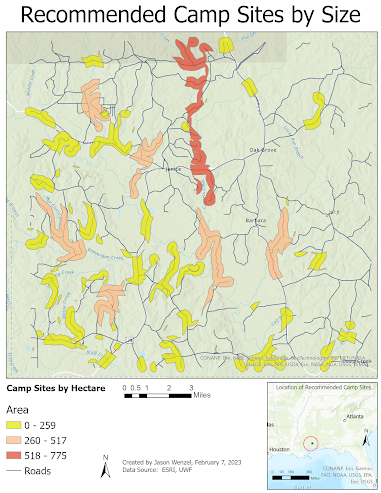
This week in GIS 5050 we had our vector analysis lab, where I learned about how vector data is stored, and to do buffer analyses, joins and unions, code attributes, and do some more advanced analysis over the previous labs.  For this week, I created the map below at an area in Mississippi that shows recommended camp sites by size (hectare) in areas that are not too close or too far from water, and away from roadways that do not overlap with conservation areas.  Overall I felt that I achieved success with the project and found it helpful in strengthening my GIS analytical skills.